import requests
import requests.auth
import os
from bs4 import BeautifulSoup
import pandas as pd
import time
import random
from datetime import datetime
from ratelimit import limits, sleep_and_retry

@sleep_and_retry
@limits(calls=100, period=3600)  # 100 calls per hour
def fetch_posts_pullpush(subreddit, timestamp, size=100):
  """
    Fetch posts from PullPush API
  """
  url = 'https://api.pullpush.io/reddit/search/submission/'
  params = {
    'subreddit': subreddit,
    'size': size,
    'sort': 'desc',
    'before': timestamp
  }

  response = requests.get(url, params=params)

  current_time = datetime.now().strftime("%H:%M:%S")

  # Handle rate limiting
  if response.status_code == 429:
    print(f"[{current_time}] Rate limit exceeded. Sleeping for 1 hour...")
    time.sleep(3600)
    return fetch_posts_pullpush(subreddit, timestamp, size)

  # return error if response is not 200
  elif response.status_code != 200:
    raise ValueError(f"Error fetching posts: {response.status_code} - {response.text}")

  data = response.json()

  # Check if data is empty
  if not data.get('data'):
    print(data)
    raise ValueError("No data found in response")

  timestamp = min([int(post['created_utc']) for post in data['data']])
  return data['data'], timestamp


def write_posts_to_csv2(posts, timestamp):
  """
    Write posts to CSV file
  """
  now = datetime.now().strftime("%Y%m%d_%H%M%S")
  filename = f"pullpush_run_at_{now}_to_{timestamp}.csv"
  df = pd.DataFrame(posts)
  df.to_csv(filename, index=False)


timestamp = int(datetime.now().timestamp())
subreddit = 'ProductManagement'
i = 0
week_of_posts = []

while True:
  i += 1
  current_time = datetime.now().strftime("%H:%M:%S")

  # Fetch posts
  # print(f"[{current_time}] Fetching posts for page {i}...")
  try:
    data, timestamp = fetch_posts_pullpush(subreddit, timestamp)
  except Exception as e:
    print(f"[{current_time}] Error fetching posts: {e}")
    week_of_posts.extend(data)
    # Write to CSV
    write_posts_to_csv2(week_of_posts, 'error')
    break

  # Check if there are more posts
  if not data or len(data) == 0:
    print(f"[{current_time}] No more posts found.")
    week_of_posts.extend(data)
    write_posts_to_csv2(week_of_posts, 'no_more_posts')
    break

  # Append posts to list
  week_of_posts.extend(data)

  # compile a week's worth of posts and write to CSV
  if i % 7 == 0:
    print(f"[{current_time}] Writing {len(week_of_posts)} posts to CSV for week {i // 7}...")
    write_posts_to_csv2(week_of_posts, timestamp)
    week_of_posts = []

  # Sleep for a random time between 1 and 3 seconds
time.sleep(random.randint(1, 3))Analyzing sentiment on r/ProductManagement
Data collection
I downloaded every post on the /r/ProductManagement subreddit to CSVs using Python and the pullpush.io API (I ran this over a weekend).
Back in R, I read all the CSVs into a single tibble, and save it as an RDS object.
# Read all CSVs from directory
filenames <-
  list.files(
    path = "drafts/reddit_sentiment/data",
    # pattern = "pullpush_run_at_20250420_120233_to_1578586913",
    pattern = "pullpush_",
    full.names = TRUE) %>%
  set_names()

# Read a CSV from a file path.
# Select a subset of columns and manually specify the types
read_posts <- function(fn) {

  p() # Update progress bar

  # Some files do not have upvote_ratio (inexplicably)
  if ("upvote_ratio" %in% names(read.csv(fn, nrows = 0))) {
    read_csv(
      fn,
      col_select = c(
        id,
        author,
        created_utc,
        subreddit_id,
        num_comments,
        upvotes = score,
        upvote_ratio,
        title,
        selftext,
        url),
      col_types = cols(
        id = col_character(),
        author = col_character(),
        created_utc = col_number(),
        subreddit_id = col_character(),
        num_comments = col_number(),
        score = col_number(),
        upvote_ratio = col_number(),
        title = col_character(),
        selftext = col_character(),
        url = col_character()))
  } else {
    read_csv(
      fn,
      col_select = c(
        id,
        author,
        created_utc,
        subreddit_id,
        num_comments,
        upvotes = score,
        # upvote_ratio,
        title,
        selftext,
        url),
      col_types = cols(
        id = col_character(),
        author = col_character(),
        created_utc = col_number(),
        subreddit_id = col_character(),
        num_comments = col_number(),
        score = col_number(),
        # upvote_ratio = col_number(),
        title = col_character(),
        selftext = col_character(),
        url = col_character())) %>%
    mutate(upvote_ratio = NA)
  }
}

# Big one: this may take a while
with_progress({
  p <- progressor(along = 1:length(filenames))

  pm_posts_raw <-
    filenames %>%
    map_df(read_posts, .id = "source_file") %>%
    distinct(id, .keep_all = T) # Remove any duplicate posts
    mutate(date = date(created_utc)) # Add a date col
})

pm_posts_raw %>%
  saveRDS(paste0(today(), "_ProductManagement_all_posts.rds"))
Let’s inspect the data
pm_posts_raw <-
    readRDS("data/ProductManagement_all_posts.rds") %>%
    mutate(date = date(created_utc))
# What are our date ranges?
pm_posts_raw %>%
summarise(
min(date, na.rm = T),
max(date, na.rm = T))# A tibble: 1 × 2
`min(date, na.rm = T)` `max(date, na.rm = T)`
<date> <date>
1 2009-10-04 2025-04-17 Posts per day
pm_posts_raw %>%
  count(date = floor_date(date, "week")) %>%
  ggplot(aes(date, n)) +
  geom_line() +
  theme(axis.text.x = element_text(angle = 45, hjust = 1)) +
  labs(
      title = "/r/ProductManagement posts per week",
      subtitle = "Does not include comments.",
  x = "Week",
  y = "New posts")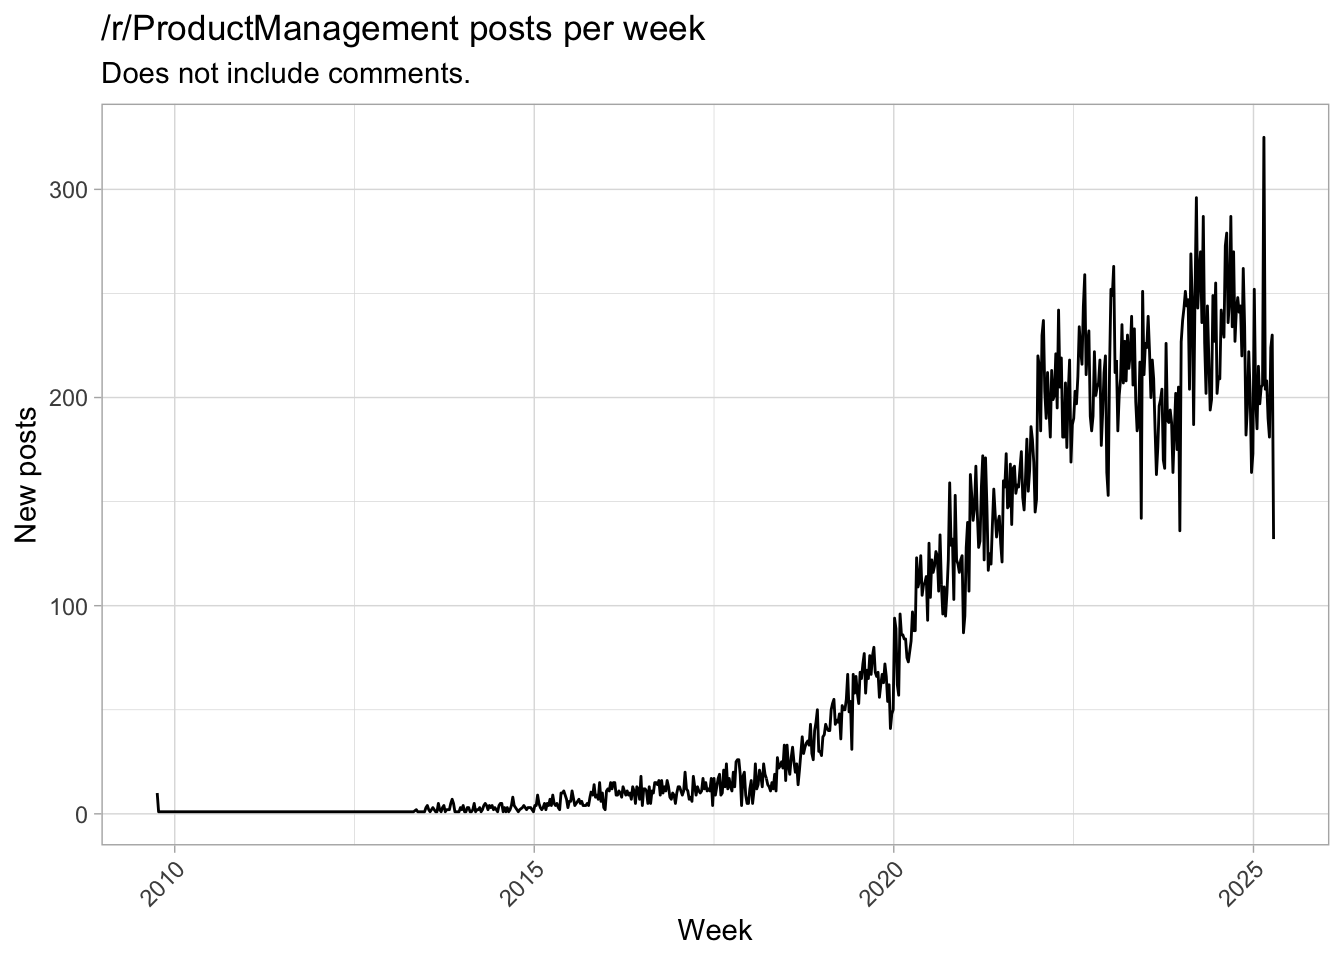
For our analysis, let’s look only at posts after 2015, because that is when it started taking off.
Upvotes and upvote ratios
pm_posts_raw %>%
  filter(date >= "2015-01-01") %>%
  ggplot(aes(upvotes, upvote_ratio)) +
  geom_point() +
  scale_y_continuous(labels = scales::percent_format()) +
  labs(
      title = "Upvotes and upvote ratio",
      y = "upvote %")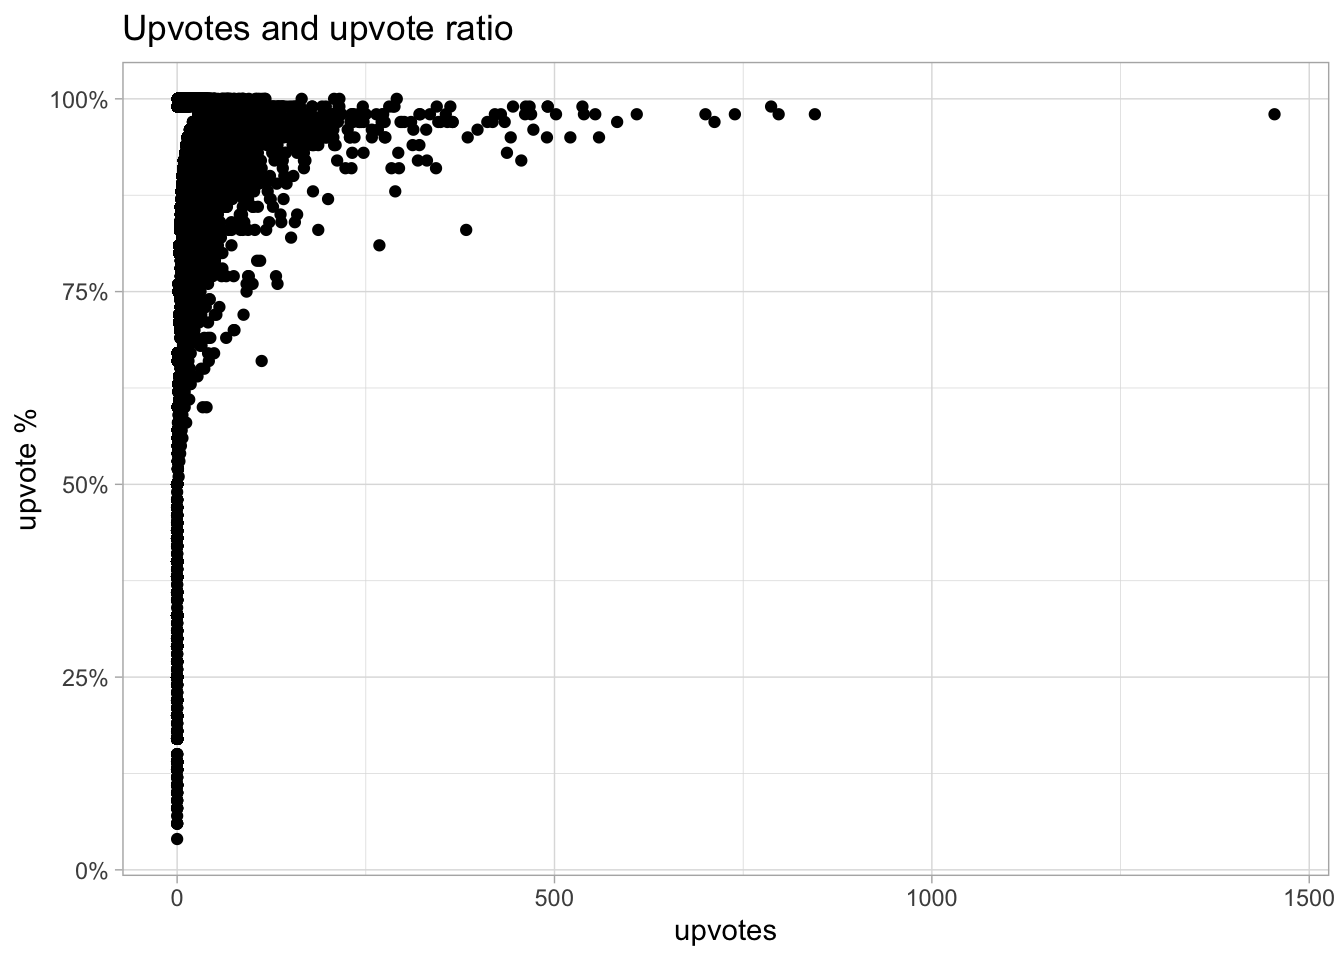
Woah, that’s a serious outlier. The most upvotes of all time, and a nearly perfect upvote ratio… what’s going on?
the_post <- pm_posts_raw %>%
  arrange(desc(upvotes)) %>%
    select(title, url) %>%
    head(1)
It’s this infamous post: My Advice on How to Be a Terrible but Valuable PM
I think this is an incredibly negative post. It’s an indictment of the entire function of product management. Is it really an outlier? Or has sentiment among PMs been decreasing over time?
Tokenize the posts
pm_tokens <- pm_posts_raw %>%
  filter(date >= "2015-01-01") %>%
  mutate(text = paste(title, "\\n", selftext)) %>%
  filter(author != "AutoModerator") %>%
  unnest_tokens(word, text) %>%
  # Remove stopwords
  anti_join(stop_words, by = "word") %>%
  # Remove "words" without letters
  filter(str_detect(word, "[A-Za-z]"))

# pm_tokens %>% saveRDS("reddit_sentiment/data/pm_tokens.rds")
# pm_tokens <- readRDS("data/pm_tokens.rds")
# Use the Bing dataset to identify sentiment of individual words
bing_word_sentiment <-
pm_tokens %>%
inner_join(get_sentiments("bing"), by = "word")
bing_word_sentiment %>%
count(date = floor_date(date, "month"), sentiment) %>%
pivot_wider(names_from = "sentiment", values_from = "n") %>%
mutate(positive_ratio = positive / (positive + negative)) %>%
ggplot(aes(date, positive_ratio)) +
geom_line() +
expand_limits(y = 0) +
scale_y_continuous(labels = scales::percent) +
labs(
title = "Overall /r/ProductManagement sentiment by month",
x = "Month",
y = "% positive words")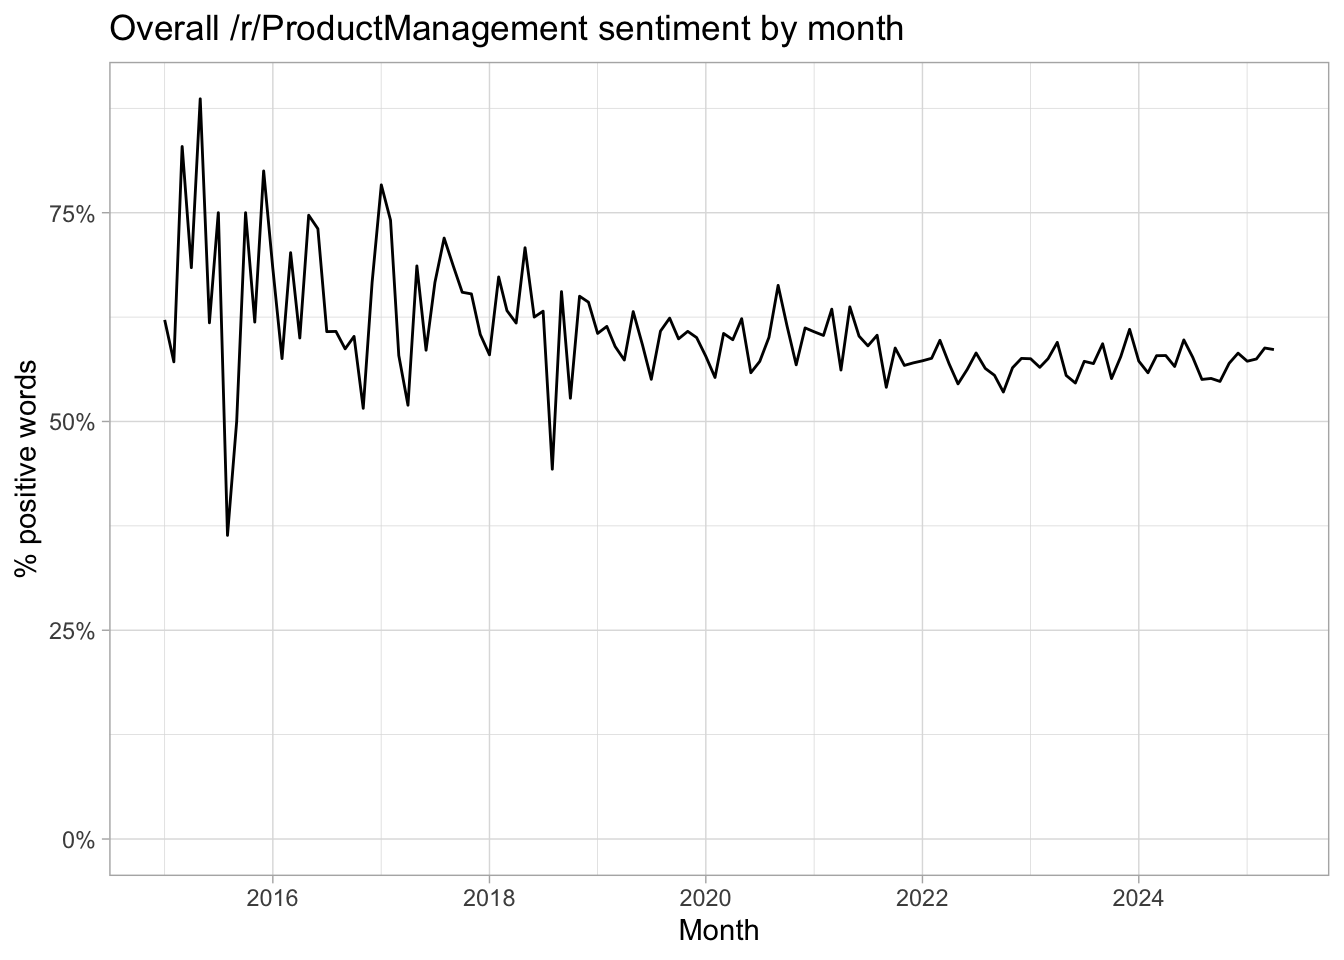
While noiser in 2016, the overall sentiment seems to settle a bit over 50%.
# Now by post
bing_word_sentiment %>%
  count(id, author, date, num_comments, upvotes, upvote_ratio, url, sentiment) %>%
  pivot_wider(names_from = "sentiment", values_from = "n") %>%
  replace_na(list(negative = 0L, positive = 0L)) %>%
  mutate(post_sentiment = if_else(positive > negative, "positive", "negative")) %>%
  count(date = floor_date(date, "month"), post_sentiment) %>%
  group_by(date) %>%
  add_count(wt = n, name = "All posts") %>%
  mutate(`% of positive posts` = n / `All posts`) %>%
  filter(post_sentiment == "positive") %>%
  pivot_longer(
      cols = c("% of positive posts", "All posts"),
      names_to = "metric",
      values_to = "value") %>%
  ggplot(aes(date, value)) +
  geom_line() +
  expand_limits(y = 0) +
  facet_wrap(~metric, ncol = 1, scales = "free_y") +
  labs(
      title = "Posts by month",
      x = "Month",
      y = "")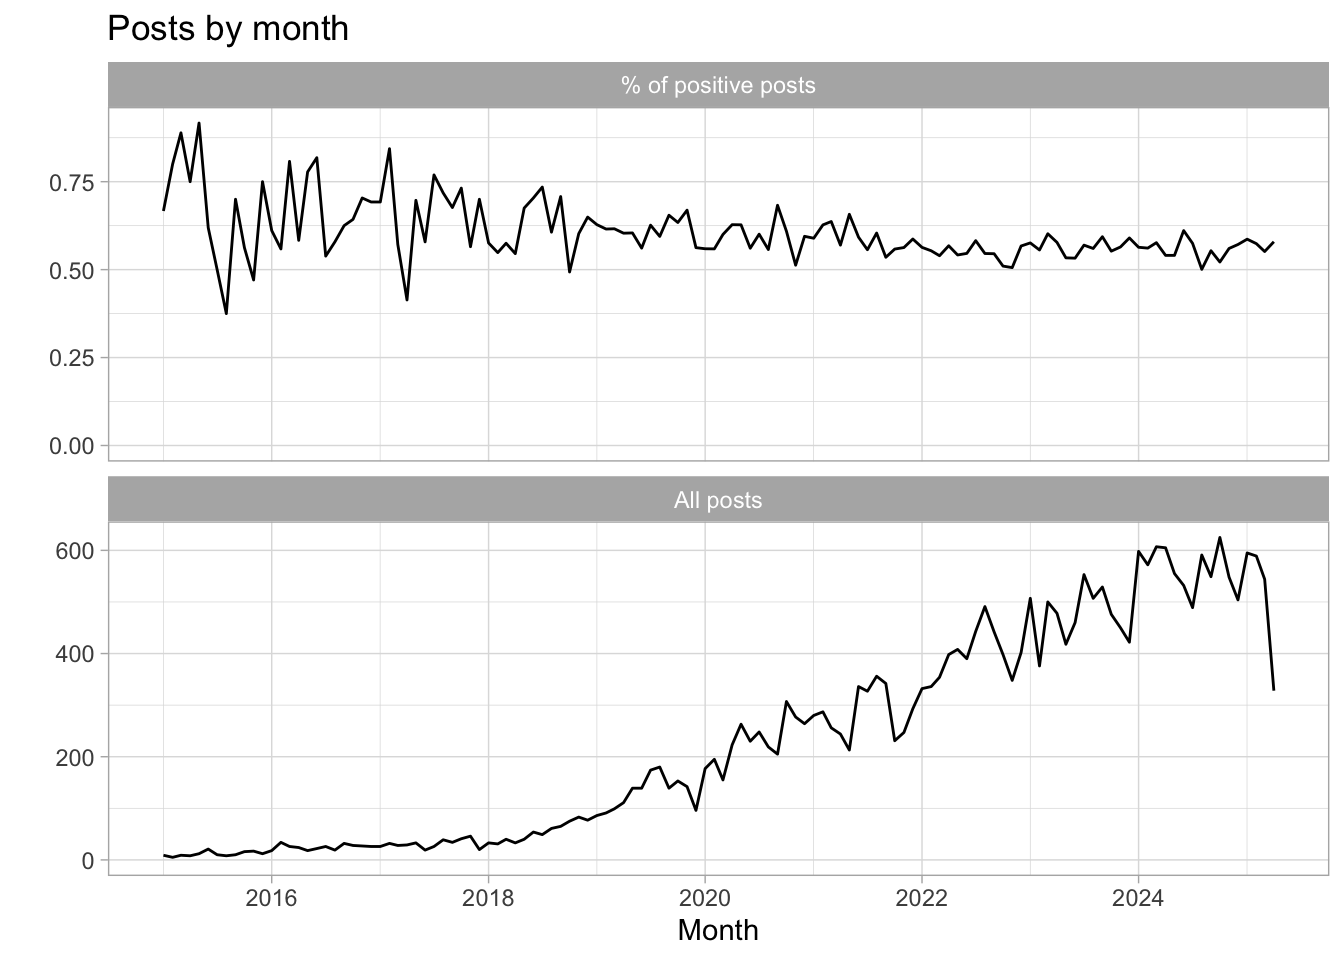
We can see that as our sample size increases, we see less noise in the percentage of positive posts.
Most popular words by sentiment
bing_word_sentiment %>%
    count(word, sentiment) %>%
    group_by(sentiment) %>%
    arrange(desc(n)) %>%
    top_n(20, wt = n) %>%
    mutate(rank = row_number()) %>%
    select(-n) %>%
    pivot_wider(names_from = "sentiment", values_from = "word") %>%
knitr::kable()| rank | positive | negative |
|---|---|---|
| 1 | love | hard |
| 2 | support | issues |
| 3 | lead | bad |
| 4 | free | break |
| 5 | success | struggling |
| 6 | top | wrong |
| 7 | pretty | issue |
| 8 | improve | difficult |
| 9 | agile | lack |
| 10 | appreciated | pain |
| 11 | recommendations | slack |
| 12 | worth | lost |
| 13 | recommend | complex |
| 14 | helpful | bugs |
| 15 | happy | stuck |
| 16 | successful | struggle |
| 17 | super | risk |
| 18 | guidance | limited |
| 19 | easy | critical |
| 20 | strong | breaking |
What words come up more now than in the past?
max_date <- pm_posts_raw %>%
    summarise(max_date = max(date, na.rm = T)) %>%
    pull(max_date)

word_freqs <- pm_tokens %>%
    group_by(period = if_else(date >= max_date - months(6), "recent", "past")) %>%
    mutate(total_words = n()) %>%
    ungroup() %>%
    count(period, total_words, word) %>%
    mutate(word_freq = n / total_words)

by_period <- word_freqs %>%
    filter(n >= 4) %>%
    select(period, word, word_freq) %>%
    pivot_wider(names_from = "period", values_from = word_freq)

# by_period %>%
#     filter(is.na(recent)) %>%
#     arrange(desc(past)) %>%
#     head(30) %>%
#     View()

by_period %>%
    filter(is.na(past)) %>%
    arrange(desc(recent)) %>%
    select(words_with_biggest_increases = word) %>%
    head(20) %>%
knitr::kable()| words_with_biggest_increases |
|---|
| v0 |
| cursor |
| agentic |
| modernization |
| aaa |
| anomalies |
| bolt |
| dsl |
| gemini |
| mic |
| jp |
| o1 |
| airtribe |
| bluesky |
| fx |
| open.substack.com |
| perplexity |
| 4o |
| cli |
| ctc |
A lot of the words that had the biggest increases in the last 6 months tend to be newer technologies: v0 (AI coding tool), Bolt (AI coding tool), o1 (OpenAI model), “agentic”, Bluesky (Twitter competitor).
# 2x2: increase / decrease x sentiment
big_movers <- by_period %>%
    filter(!is.na(past), !is.na(recent)) %>%
    mutate(pct_change = (recent - past) / past) %>%
    inner_join(get_sentiments("bing"), by = "word") %>%
    arrange(desc(abs(pct_change))) %>%
    select(word, pct_change, sentiment)

# big_movers %>%
#     filter(sentiment == "positive") %>%
#     View

big_movers %>%
    mutate(pct_change = scales::percent(pct_change)) %>%
    filter(sentiment == "negative") %>%
    head(20) %>%
knitr::kable()| word | pct_change | sentiment |
|---|---|---|
| bust | 945% | negative |
| dismissive | 553% | negative |
| distrust | 553% | negative |
| unwilling | 444% | negative |
| overloaded | 390% | negative |
| anomaly | 367% | negative |
| disheartening | 367% | negative |
| hedge | 357% | negative |
| abysmal | 335% | negative |
| devastated | 335% | negative |
| dissatisfaction | 335% | negative |
| imperfect | 335% | negative |
| impractical | 335% | negative |
| notoriously | 335% | negative |
| unpredictable | 335% | negative |
| clash | 308% | negative |
| rigid | 292% | negative |
| insufficient | 273% | negative |
| twist | 263% | negative |
| hype | 235% | negative |
There are some big increases in clearly negative PM words. Note: the pct_change is calculated as the percent increase between the frequency of the word in the posts from the past 6 months vs the posts from longer than 6 months ago.
Here are the words with a positive sentiment that have changed the most:
big_movers %>%
    mutate(pct_change = scales::percent(pct_change)) %>%
    filter(sentiment == "positive") %>%
    head(20) %>%
knitr::kable()| word | pct_change | sentiment |
|---|---|---|
| portable | 926% | positive |
| flawless | 880% | positive |
| lucid | 717% | positive |
| polished | 613% | positive |
| toughest | 553% | positive |
| smarter | 345% | positive |
| autonomous | 325% | positive |
| elevate | 320% | positive |
| readable | 292% | positive |
| elite | 273% | positive |
| exceeded | 273% | positive |
| praising | 273% | positive |
| joy | 267% | positive |
| celebration | 263% | positive |
| prompt | 234% | positive |
| adaptable | 227% | positive |
| exceeding | 227% | positive |
| seamless | 227% | positive |
| smoother | 227% | positive |
| enthusiasm | 205% | positive |
While these seem like generally positive words, this is a very dated approach to sentiment analysis with major limitations. For instance, even a seemingly positive word like “hug” can be quite misleading.
Here are the search results on the subreddit for posts that contain “hug”:
Imposter syndrome - does every PM feel it?
I am giving up on my career
Weekly rant thread
I feel like I’m under attack
Guidance. PM team needs some love.
Rant: Executives: If you don’t care about the role, please stop being a part of the interview process
Very new PM with ADHD, How do I tackle my weaknesses?
Keeping up energy levels w/ high volume of meetings
Unfair Performance management
These are incredibly negative posts. PMs out there seem to be struggling.